

THREE REASONS WE LIKE SMALL CAPS

October 19, 2020
THREE REASONS WE LIKE SMALL CAPS
Jeffrey Buchbinder, CFA, Equity Strategist, LPL Financial
Scott Brown, CMT, Senior Analyst, LPL Financial
Nick Pergakis, Analyst, LPL Financial
Markets have come a long way since the March lows, but we believe there may be more room for stocks to run. Given the impressive economic recovery to date and improving underlying technical and fundamental conditions, we think small cap stocks in particular may have attractive growth potential. Despite election and COVID-19-related risks, we see further gains ahead.
NOT OUT OF THE WOODS, BUT IMPROVING
The significant impact of COVID-19 on the US economy has created unprecedented levels of uncertainty for investors, with a heated election as the cherry on top for 2020. Investors have had a lot to digest since markets bottomed in March, and the virus is not yet under control, but the US economy is certainly in a much better place today than it was in the spring. While we previously have favored large cap stocks due to their strong balance sheets and resilient earnings during this recession, we highlight three reasons we have been warming up to small cap stocks.
EARLY-CYCLE ENVIRONMENT FAVORS SMALL CAPS
We believe the latest recession is over and the new economic expansion has begun. The Federal Reserve of Atlanta’s GDPNow updated its forecast to 35% gross domestic product (GDP) growth in the third quarter on an annualized basis, potentially confirming our view that the recession has ended. While we acknowledge the immense amount of uncertainty facing the economy, along with the growing risk that there may be no additional fiscal stimulus until after the election, we stop short of calling for a “double dip” recession.
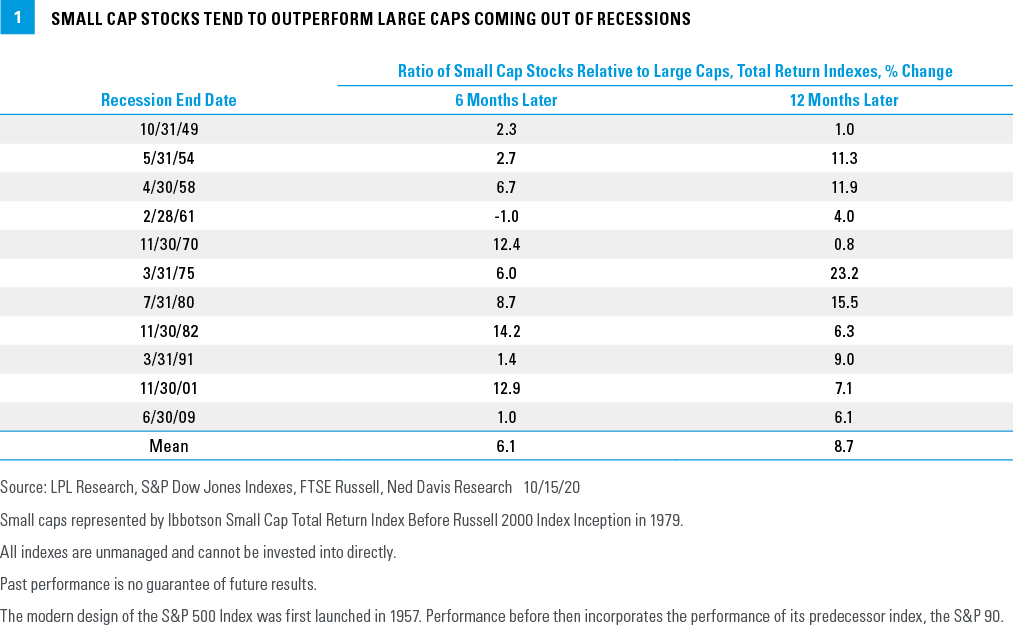
Given our view that we’re in the early stages of the business cycle and a new bull market, we point out that small cap stocks historically have performed well relative to their large cap counterparts coming out of recessions [Figure 1]. The story is the same coming off of major bear market lows where, on average, small caps have outperformed large caps by about 15% during the first year of bull markets, according to a study by Ned Davis Research.
STREAK OF UNDERPERFORMANCE MAY BE OVER
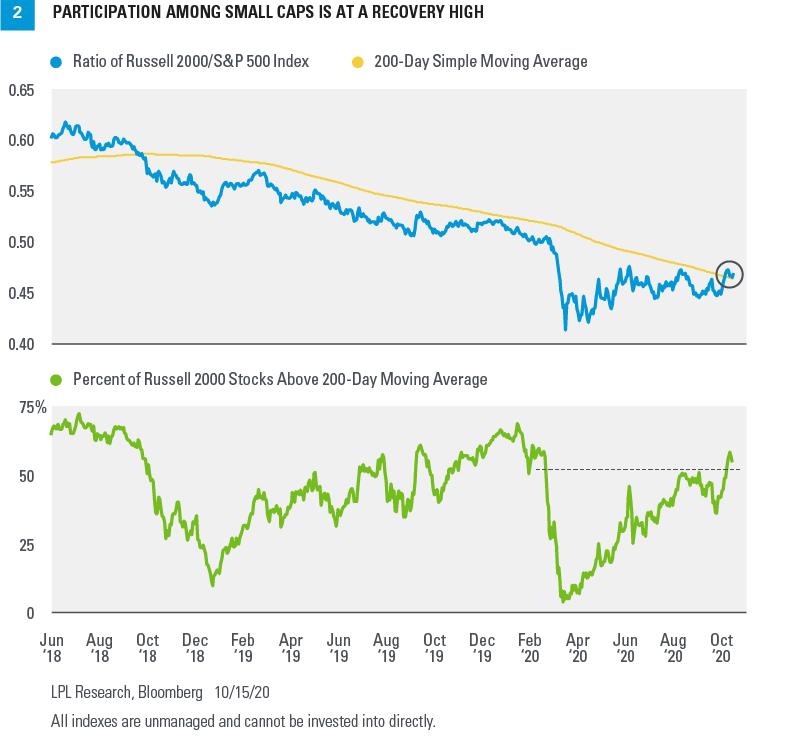
Historically, small caps have outperformed coming off major bear market bottoms, but from a technical perspective, we want to see evidence of that out performance occurring this cycle. Small caps underperformed large caps by 33% from June 2018 through the March 2020 lows, as measured by the Russell 2000 Index, meaning that the trend of large caps outperforming small caps began long before the bear market decline [Figure 2]. However, since the March 23 low, the Russell 2000 has outperformed the S&P 500 Index by more than 13%, and the ratio between the two indexes has moved back above the 200-day moving average for the first time in more than two years. We do not view this as a timing signal to go significantly overweight small caps, but believe it demonstrates that the trend has shifted to a more neutral stance between large and small.
Additionally, participation at the individual stock level among small caps has continued to improve, consistent with positive breadth signals we are seeing in large cap indexes. As of October 12, nearly 60% of the individual stocks in the Russell 2000 were trading above their respective 200-day moving averages, the most we have seen since the stock market bottomed in March. This helps to show that improved performance is not limited to a particular style or sector of the index, but that participation is healthy and trending upward.
Finally, within the small cap universe, there are notable relative winners. While the broad Russell 2000 has not made a new record high since August 2018, the Russell 2000 Growth Index made a new high as recently as the week of October 12, and it’s actually outperforming the S&P 500 year-to-date. This is yet another sign that the trend favors growth over value regardless of the market capitalization segment.
SMALL CAP EARNINGS POISED FOR A STRONG 2021
During recessions, smaller companies, which generally tend to have weaker balance sheets and more economically sensitive revenue, are usually hit harder than their large cap brethren. That has certainly played out this year, with the latest Fact Set consensus estimates calling for an 18% annual decline in large cap (S&P 500) earnings compared with a 61% decline in small cap (Russell 2000) earnings. As stated previously, we suspect the US economy has already emerged from the recession. While small cap market returns are typically strong coming off bear market bottoms and out of recessions, strong earnings growth usually follows. Case in point, for 2021 small cap earnings are expected to rebound sharply—potentially by 180% based on the latest Fact Set estimates—to more than 10% above 2019 levels. Simply put, greater economic sensitivity provided by small cap stocks compared with large cap stocks may be helpful when economic growth expectations go from bad to less bad, and eventually to good.
Further, consider that small cap earnings momentum has been quite positive. Since June 30, 2020, small cap earnings estimates for 2020 have been revised about 12 percentage points higher, more than the 4–5 percentage points for large caps. For 2021, earnings growth for small caps has been revised more than 30 percentage points higher, while large cap estimates have increased by only 2 points.
A FEW CONCERNS WORTH NOTING
Why are we not committing to an overweight small caps recommendation? First of all, there is still the risk that COVID-19 could derail the economic recovery, and we think large cap stocks are better positioned for the stay-at-home and work-from-home environment during the pandemic. Second, we expect a weaker US dollar, which tends to be more positive for large caps that have greater international revenue exposure. Third, higher corporate tax rates—if we get them—may hurt US-focused smaller cap companies more after they benefited more from the Tax Cuts and Jobs Act of 2017. Finally, although we don’t typically use valuations as a short term indicator, valuations for small caps remain elevated relative to large caps.
CONCLUSION
We acknowledge that the greater financial strength enjoyed by large caps has helped that asset class in this uncertain environment, but we have seen broad-based improvement in the underlying conditions that may be supportive of small caps. While risks to the economic recovery continue to loom, if the economic expansion becomes more durable, we would expect even greater participation across the market capitalization spectrum.
IMPORTANT DISCLOSURES
This material is for general information only and is not intended to provide specific advice or recommendations for any individual. There is no assurance that the views or strategies discussed are suitable for all investors or will yield positive outcomes. Investing involves risks including possible loss of principal. Any economic forecasts set forth may not develop as predicted and are subject to change.
References to markets, asset classes, and sectors are generally regarding the corresponding market index. Indexes are unmanaged statistical composites and cannot be invested into directly. Index performance is not indicative of the performance of any investment and do not reflect fees, expenses, or sales charges. All performance referenced is historical and is no guarantee of future results.
Any company names noted herein are for educational purposes only and not an indication of trading intent or a solicitation of their products or services. LPL Financial doesn’t provide research on individual equities.
All information is believed to be from reliable sources; however, LPL Financial makes no representation as to its completeness or accuracy.
US Treasuries may be considered “safe haven” investments but do carry some degree of risk including interest rate, credit, and market risk. Bonds are subject to market and interest rate risk if sold prior to maturity. Bond values will decline as interest rates rise and bonds are subject to availability and change in price.
The Standard & Poor’s 500 Index (S&P500) is a capitalization-weighted index of 500 stocks designed to measure performance of the broad domestic economy through changes in the aggregate market value of 500 stocks representing all major industries.
The PE ratio (price-to-earnings ratio) is a measure of the price paid for a share relative to the annual net income or profit earned by the firm per share. It is a financial ratio used for valuation: a higher PE ratio means that investors are paying more for each unit of net income, so the stock is more expensive compared to one with lower PE ratio.
Earnings per share (EPS) are the portion of a company’s profit allocated to each outstanding share of common stock. EPS serves as an indicator of a company’s profitability. Earnings per share are generally considered to be the single most important variable in determining a share’s price. It is also a major component used to calculate the price-to-earnings valuation ratio.
All index data from FactSet.
Please read the full Midyear Outlook 2020: The Trail to Recovery publication for additional description and disclosure.
This research material has been prepared by LPL Financial LLC.
Securities and advisory services offered through LPL Financial (LPL), a registered investment advisor and broker-dealer (member FINRA/SIPC). Insurance products are offered through LPL or its licensed affiliates. To the extent you are receiving investment advice from a separately registered independent investment advisor that is not an LPL affiliate, please note LPL makes no representation with respect to such entity.
Not Insured by FDIC/NCUA or Any Other Government Agency | Not Bank/Credit Union Guaranteed | Not Bank/Credit Union Deposits or Obligations | May Lose Value
RES-07450-1020 | For Public Use | Tracking # 1-05068525 Exp. 10/21)